COMING SOON
3D graphing, for when 2 dimensions doesn’t float your boat
Do you have the need for a graphing calculator but can’t find one that satisfies your needs? Look no further, because we’ve got what you want!
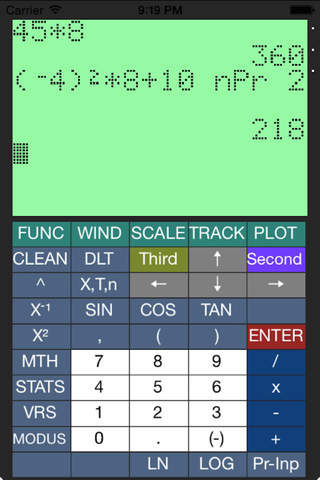
Digit GC is a graphing calculator capable of delivering all the functionality a Dutch high school student needs. We have set this standard because we strive to make graphing calculating available on iDevices, so that you don’t need anything else with you besides that.
To ensure the calculator matches your or perhaps your school’s desires when it comes to how the calculator looks, we have implemented a completely modifiable layout. This means that you can change the buttons the calculator uses in various ways. You can change the position, color, text and even what a button does.
If for instance you have a standard to comply to, you can create a layout for it. Once you are finished, you can export the layout as plain text and send it to other people who need to use it or use it as a backup. When you need to use a exported layout, you can simply copy it into the calculator and it will change accordingly. Currently, it’s even easier in the iPhone version, where you only have to copy the text, the app will handle the rest.
Functions the calculator has include:
- Normal calculation (+, -, *, /)
- Advanced calculation (sin, cos, tan, π, e, power, inverse sin cos tan, square root, log, ln)
- Angles in degrees or radians (you can change this to your liking in a menu)
- Different rounding modes (normal, scientific)
- Rounding to a specific number of decimals (you can set the number of decimals to round to)
- Imaginary numbers (i)
- Statistical functions (binomial, normal)
- Lists (sum of a list, cumulative sum of a list)
- List editor + list variables (edit list variables in a special editor)
- Graphs (up to ten functions to graph)
- Graph calculations (Specific value, Intersection with zero, minimum, maximum, intersection, dy/dx, integrals)
- Graphs with function pairs (you can set functions for x as well as y)
- Sequence graphs (make up to three sequences)
- Statistical plots (point cloud, line graph, histogram, box plot, normal probability plot)
- Graph data screen (shows your graphs as point data, rather than a line)
- Memory of calculations you made (you can use them again)
- Fraction converter (convert a decimal number to a fraction)
- Extensive help files (contains information to get you started on calculating)
And much more!


